
Every Extra Second Costs You Customers
One extra second of load time cuts conversions by up to 7 percent, and Google ranks on Core Web Vitals directly. We fix the server, the application and the front-end code, then show you the before and after.
Get a free performance auditSee speed work we have delivered
Free. No pitch. A real person replies within one working day.






Slow Costs You Twice
Core Web Vitals feed straight into how Google ranks a page, so a slow site competes at a disadvantage no matter how good the content is. On a competitive keyword where everyone has covered the same ground, speed is often what separates them.
The second cost is the one you can see in analytics. Mobile visitors leave when a page takes more than three seconds. Take a four-second site down to 1.8 and the conversion gain usually covers the work within weeks.
The numbers behind it
- 7% of conversions lost per extra second of load time
- 3 seconds is where mobile visitors start abandoning
- 2.5 seconds is Google’s threshold for a good LCP score
- 4 to 8 weeks for ranking gains to show after the work lands
The Three Scores, and What We Change
Google grades every page on three things. Here is what each one measures and the work that actually moves it.
Largest Contentful Paint
How long before the main thing on the page is actually visible. Google wants it under 2.5 seconds. This is the one your visitors feel.
What we fix
- Server response time and full-page caching
- Images resized, compressed and served in modern formats
- Render-blocking CSS and fonts taken off the critical path
Interaction to Next Paint
How quickly the page reacts when someone taps or clicks. A page can look loaded and still freeze. Under 200ms is the target.
What we fix
- JavaScript audited, split and deferred
- Third-party tags and trackers cut back or delayed
- Long-running tasks broken up so the main thread stays free
Cumulative Layout Shift
How much the page jumps about while it loads. Google wants a score below 0.1. Usually it is images and injected banners.
What we fix
- Width and height set on every image and embed
- Space reserved for cookie banners and ad slots
- Web fonts loaded so text does not reflow when they arrive
Days 1 to 3: Full performance audit
Baselines taken with PageSpeed Insights, WebPageTest and Lighthouse across mobile and desktop, plus a look at server configuration, database query performance and what your third-party scripts are costing you. You get a written list of fixes ordered by expected impact, not by how easy they are.
Day 3: Agree the target scores
We put numbers on it before any work starts. For most projects that is LCP under 2.5 seconds, INP under 200ms and CLS under 0.1, measured on real-world connections rather than lab conditions alone. You approve the targets and the list.
Weeks 1 to 2: Implementation
On WordPress: plugin audit, Redis object caching, full-page caching, image optimisation, CDN and front-end work in the theme. Magento adds Varnish, Elasticsearch and database indexing. Drupal gets views caching and BigPipe. Nothing visible to your visitors changes unless we have agreed it first.
End of week 2 or 3: Retest and document
Retested across the same conditions as the baseline and compared side by side. You get the before and after in writing, so you can see exactly what changed and what it was worth.
Ongoing: Monitoring
Speed decays as content builds up and plugins get added. Our support plans re-check performance regularly and alert you when a score drops below the threshold we agreed.
Speed Work We Can Point At
Typical numbers across our engagements: LCP down 40 to 60 percent, server response halved or better, and PageSpeed scores moving out of the 40s into the 80s or 90s. Ranking gains usually show four to eight weeks later as Google recrawls. Conversion changes turn up in analytics within days.
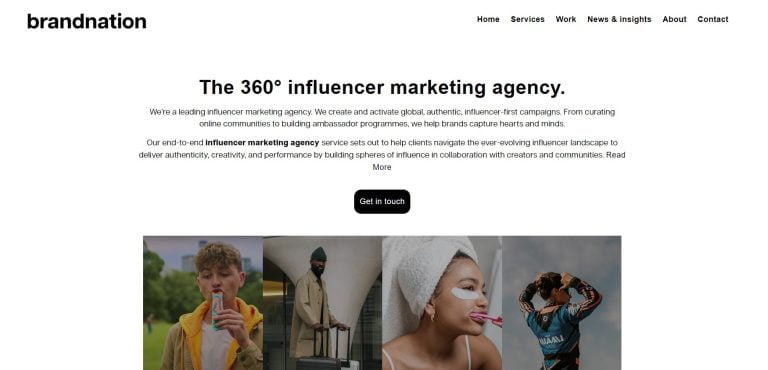 Brandnation
Professional Services
Website Performance, Lighthouse Score Significant Improvement in Website Speed
Read the case study
Brandnation
Professional Services
Website Performance, Lighthouse Score Significant Improvement in Website Speed
Read the case study
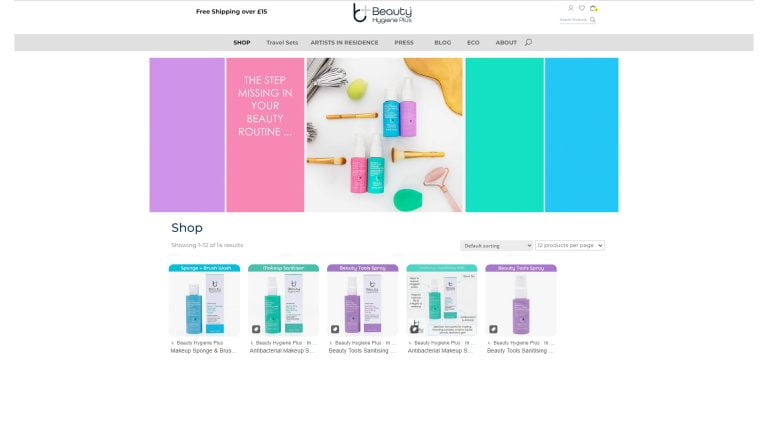 Beauty Hygiene Plus
Ecommerce
Sales Uplift, Hosting and Support Costs Enhanced Sales and Reduced Costs for Beauty Hygiene Plus
Read the case study
Beauty Hygiene Plus
Ecommerce
Sales Uplift, Hosting and Support Costs Enhanced Sales and Reduced Costs for Beauty Hygiene Plus
Read the case study
 Sumo Group
Gaming
Job Applications / month Tickets submissions / month Tickets resolution time How to increase job applications by 40.63%
Read the case study
Sumo Group
Gaming
Job Applications / month Tickets submissions / month Tickets resolution time How to increase job applications by 40.63%
Read the case study
Questions people ask before booking
What do I actually get?
How do I know if my site has a performance problem?
Can you optimise a site without access to the hosting environment?
Will performance optimisation affect how my site looks?
Do you provide ongoing performance monitoring?
How quickly can improvements be implemented?
Not sure where you stand? Run your URL through PageSpeed Insights, and if mobile comes back under 70, call +44 (0) 20 8068 0360.
Find Out What Your Speed Is Costing You
Send us the URL and the platform. Here is what comes back.
- Your current LCP, INP and CLS on mobile and desktop, against Google’s thresholds
- What is actually causing them: server, images, scripts or third-party tags
- The fixes ranked by expected impact, not by how easy they are
- Realistic target scores and what they are worth in conversion terms
- A timescale, and a price agreed before any work starts
Free. No pitch. A real person replies within one working day.
Request a Performance Audit
Tell us your site and which platform it runs on. We will test it before we reply.